
Episode 9 · August 13, 2026 · Hosted by Sebastian
Value Streams: Turning Scattered Diagrams Into a Connected Landscape
How to organise a pile of loose BPMN diagrams into a landscape that shows how the business actually works. We set out the levels from landscape to value stream segments to business processes to system views, compared top-down and bottom-up approaches, and linked processes horizontally to follow the journey end to end.
The big takeaway
A process landscape should do more than organise diagrams. It should show how the business actually works.
A connected landscape gives people a map to find the processes that matter to them, while creating the connected operational context AI needs to become genuinely useful. You're not just organising BPMN. You're mapping the operational DNA of the organisation.
What we walked through
- 01
Value streams
Use simple segments to organise your BPMN diagrams around how value flows through the business.
- 02
The levels
Start with the landscape, then value stream segments, then business processes, then system views.
- 03
Greenfield: top-down
Agree on the top-level value streams with leadership first. Then use them to guide what gets modelled.
- 04
Existing chaos: bottom-up
Create the top-level value stream landscape, then thread your existing models into it. AI can help identify where each model belongs, for leaders to review.
- 05
Connect the flow
Link upstream and downstream processes horizontally so you can follow the journey end to end.
- 06
Don't try to map everything
Pick one core value stream to start with and connect its processes properly, vertically and horizontally. One fully connected value stream will teach you more than a half-mapped landscape.
Discuss this episode
Ask a question, share how you would model it, or suggest the next topic.
More episodes
All episodes →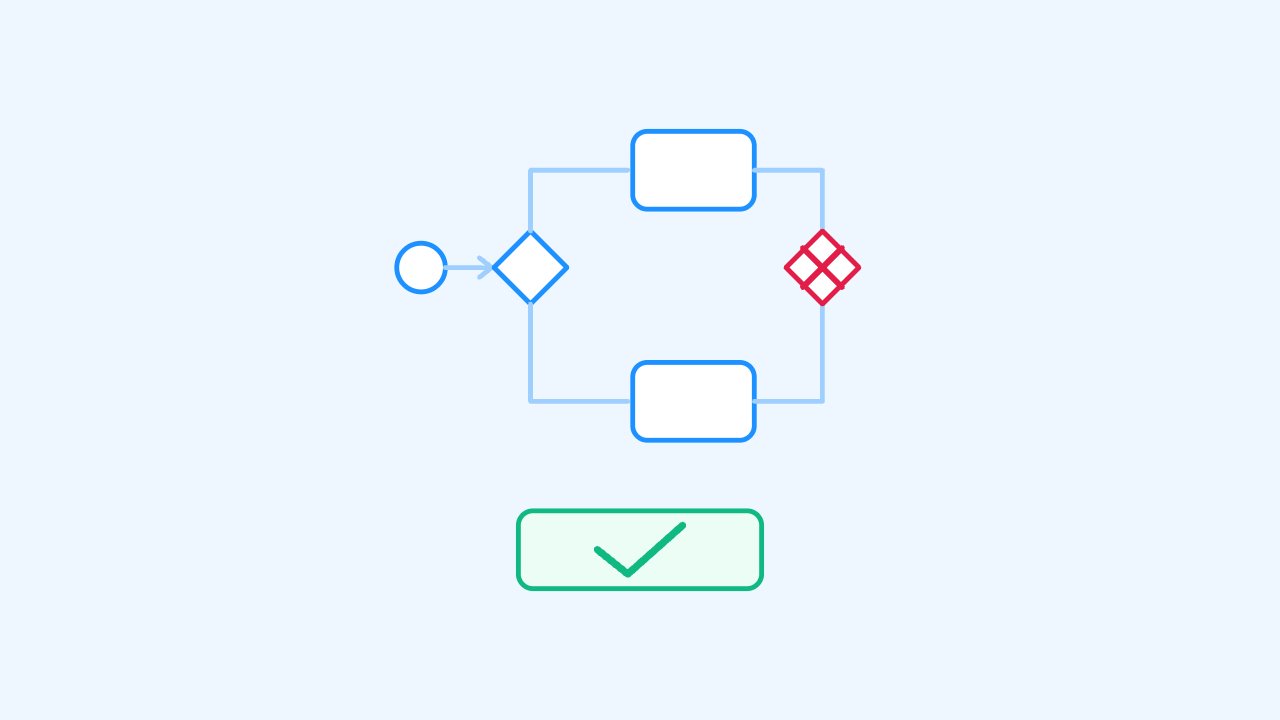
Most BPMN Diagrams Get This Wrong
Why mixing departments, systems and roles in the same view quietly breaks a process landscape. We tied each view to a modelling level: on the business level, lanes show responsibilities; on the system level, systems become pools and message flows show their interactions. And we landed on one principle: consistency beats correctness.
Everything Your Diagram Doesn't Tell You
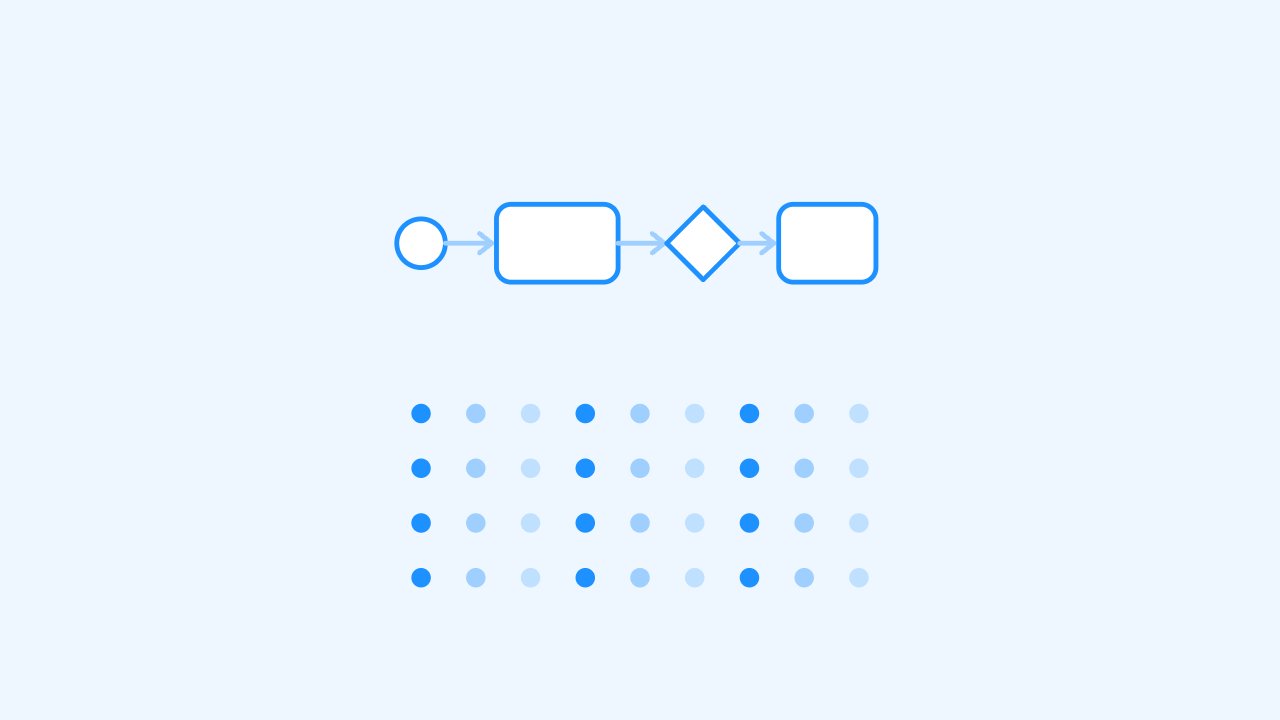
The attribute layer: the information your diagram carries without ever showing it. On a single quote creation process we tagged risks from a central catalogue, maintained documents once, added task costs and gateway probabilities, classified tasks, and had an AI agent read all of it with reasoning you can trace back to the process.

Where Should AI Go First? Prioritizing Processes and Tasks With Attributes
How to prioritise AI initiatives from your process models instead of case by case. We ran two passes: on the process level, two simple attributes and a filter produced a shortlist; on the task level, value potential against feasibility picked the first initiatives. In our example that left five concrete opportunities.